How to sort pivot data in descending order in Google Sheets (Part 1)
One of the main benefits of working with spreadsheets is the ability to aggregate data, that means to sum up values, count a number of items, etc. Google Sheets has an easy built-in Pivot Table. If you are new to spreadsheets, start there.
If you are looking for an even more powerful solution, one that helps you have multiple pivot tables on one sheet OR one that allows you to show in which order you want to sort your numbers (ascending, descending), then the Query() function is what you need.
1. Pivot Tables
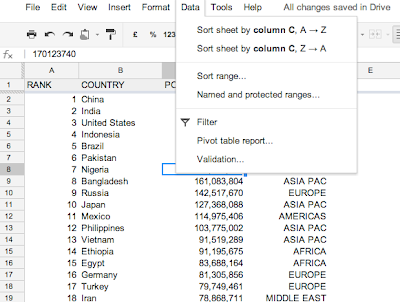
In the sheet above, the world's population is listed by country and column D holds the country's region. In the example below, we want to aggregate the world's populations by region. Click on Data, then Pivot Table report...
In the Report Editor, the field "Region" is added to the Rows and the field "Population" (which holds the population count from each country) is added to the Values section.

You can see that numbers are not ordered in increasing or decreasing order. That's because by default results are sorted by increasing order of numbers or text (alphabetical) of the first Row. For anyone who knows how easy it is to do that in Excel it can be quite frustrating, especially since the behavior affect how charts look like.

So, how can you sort values in our pivot table by decreasing order ? Not in the Report Editor, but with the Query() function. Click here to learn how to use the Query() function in Google Sheets to sort data in a more powerful way.
Have fun with spreadsheets !

Comments
Post a Comment